DTU: Database Transaction Unit
DTU is an important keyword to understand, especially for those who have been thinking about migrating databases from on-premise MS SQL Server to Azure SQL. Before the migration, there is normally a question to ask, “which service tier and performance level should I use and how much do I need to pay?” Hence, if you read the Azure SQL pricing page, you will be presented with tables similar to what is shown below. [caption id=“attachment_21526” align=“aligncenter” width=“1058”]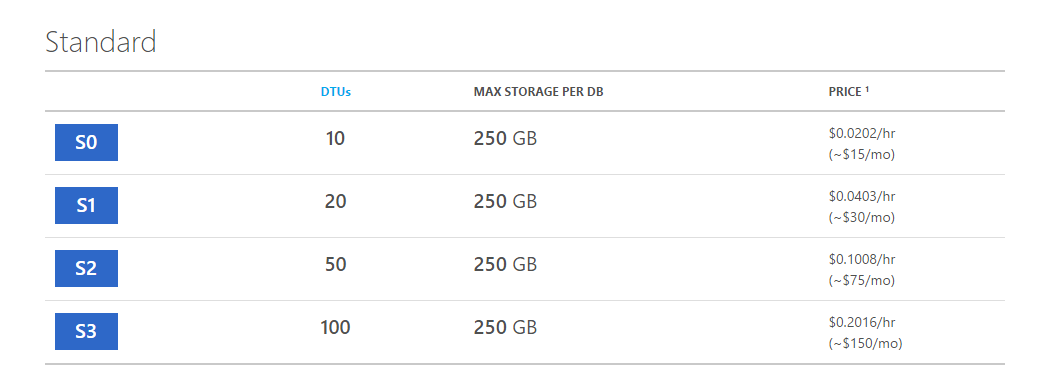 Azure SQL Pricing (Southeast Asia)[/caption] As shown in the table above, there are four performance levels for Standard Single Database Model, i.e. S0, S1, S2, and S3. Four of them having the same maximum storage for each database, however, they are charged differently because the DTUs they offer are different. So, what is DTU, or the Database Transaction Unit? When the new Azure SQL database service tiers are introduced, DTU is used as a way to describe the relative capacity of a performance level based on a blended measure of CPU, memory and IO rates. DTU is the unit of measure representing the relative power of databases based on the database transaction. S0 offers 10 DTUs, which means S0 can complete only 10 transactions per second. For me, the concept of DTU is a bit vague. When I look at the old chart in Azure SQL Pricing, there was actually an additional row called “Transactions per Second” which had value about the same as or lower than the corresponding DTU. Thus, S0, for example, can in fact only complete 8.7 transactions (instead of 10) per second. So, is there any method to help us making changes in our queries so that we can utilize the given resources in a good manner? Or, how do we know where our DTUs are spent?
Query Performance Insight
In the new Microsoft Azure Portal, there is now a preview feature which tells us DTU consumption of our top queries over the time. By default, this feature is not enabled. So, to enable it, we need to browse to a SQL database and click “Query Performance Insight” under the “Settings” of the selected database. [caption id=“attachment_21530” align=“aligncenter” width=“1366”]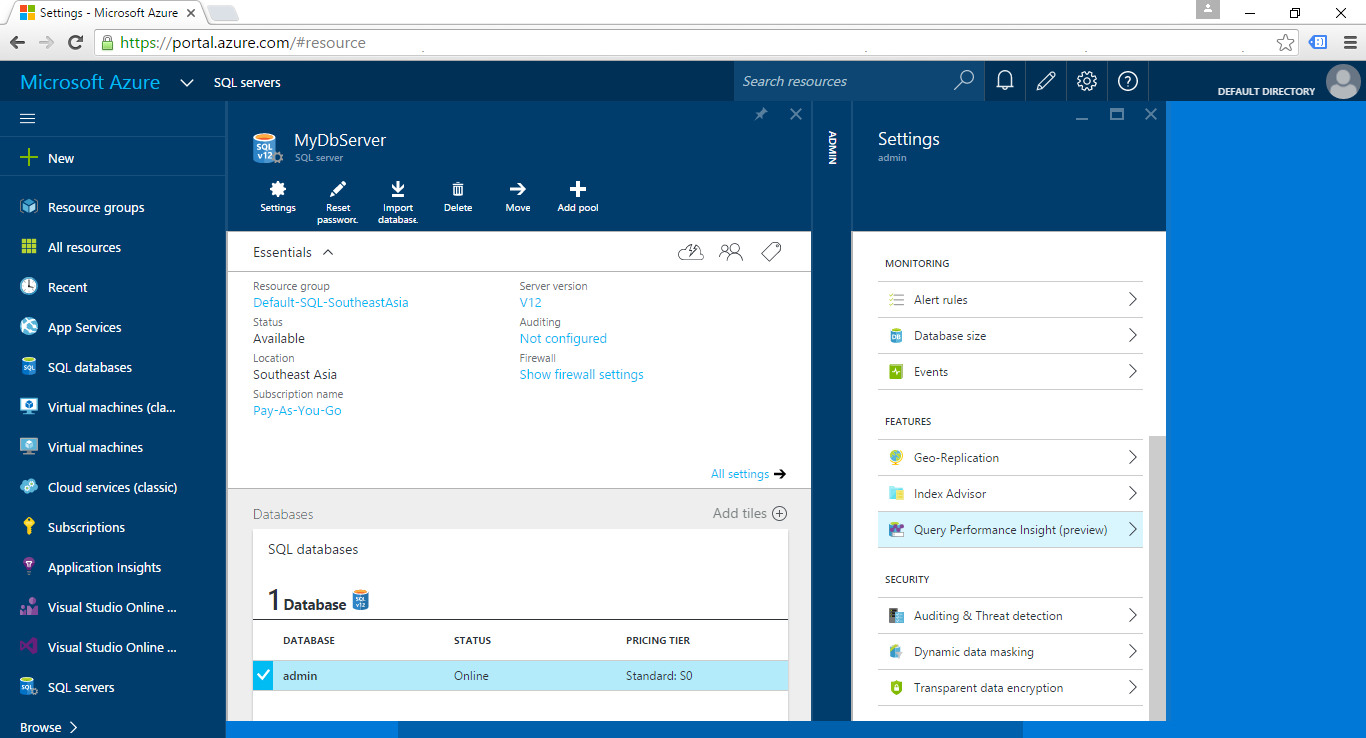 Where to find the “Query Performance Insight” menu?[/caption] A chart showing the overall DTU percentage for the database will be displayed. In fact, the chart will also show the CPU consumption of the top five queries. However, due to the fact that except the 1st query uses only 0.01% of CPU and the rest is 0%, so there is almost no bar shown on the chart except the DTU usage line. [caption id=“attachment_21532” align=“aligncenter” width=“855”]
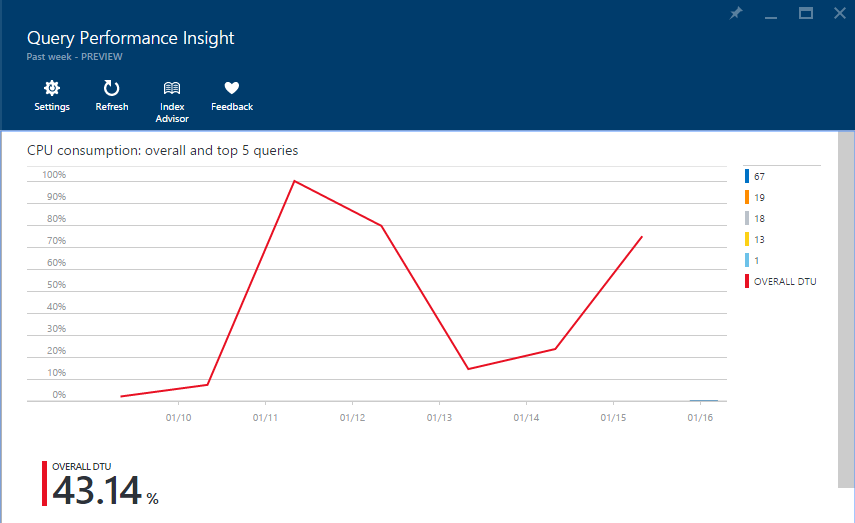 DTU percentage of my database.[/caption] In addition, by clicking on any of the top 5 query listed below the chart, we will be presented details of the query, such as the SQL itself, duration, number of executions, and CPU percentage. [caption id=“attachment_21533” align=“aligncenter” width=“854”]
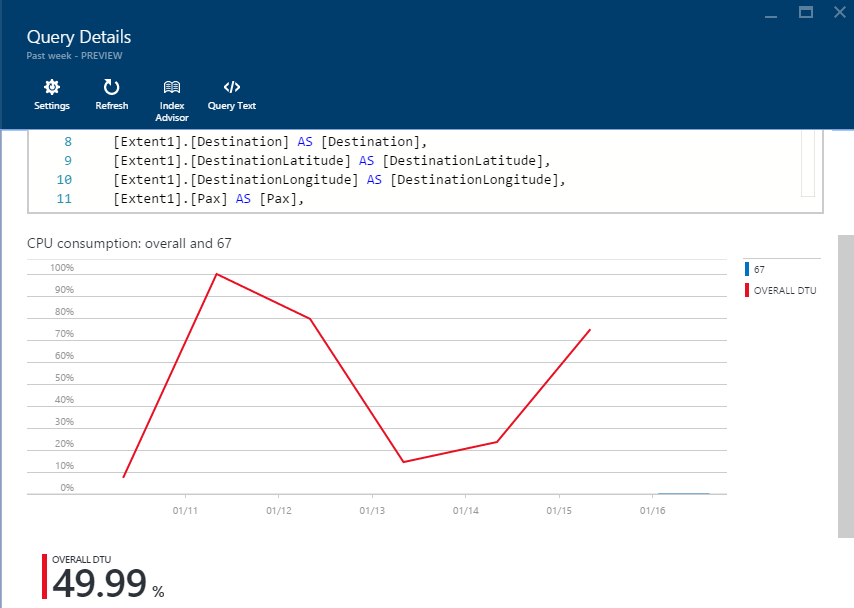 Query Details[/caption] Finally, if you have noticed, there is an “Index Advisor” button on top of the panel. It helps analyzing our database to check if there are indexes need to be added in order to improve our current query performance. Yup, so with this new tool in Microsoft Azure Portal, monitoring and improving our query performance is getting easier. I hope you find this tool easy to use as well. =)